Watch this video to see how differentiation which is one component of the study of math called CALCULUS is used in real life applications.
Please proceed on to Lesson 1 on the main topical menu for Chapter 17.

Thursday, February 2, 2012
Lesson 4: Examples on Differentiating Trigonometric Functions and Equations.
In this video you will learn to do 3 examples on differentiating Trigonometric Functions and Equations:
Please complete the worksheet on lesson 4 and proceed on to lesson 5.
Please complete the worksheet on lesson 4 and proceed on to lesson 5.
Lesson 3 : Differentiation of Trigonometric Functions of (ax+b).
In this video you will learn the formula for differentiating trigonometric functions of (ax+b) :
Please complete the worksheet on lesson 3 and proceed on to lesson 4.
Lesson 2: Differentiation of Further Trigonometric Functions.
In this lesson video, you will learn the formulas for further trigonometric functions.
Differentiation of Trigonometric Functions with powers of n :
Please complete the worksheet on Lesson 2 and proceed on to Lesson 3.
Differentiation of Trigonometric Functions with powers of n :
Please complete the worksheet on Lesson 2 and proceed on to Lesson 3.
Lesson 1 : Derivation of Basic formulas for Differentiation of Trigonometric Functions.
In these series of videos you will learn to derive the basic general formulas for differentiation of trigonometric functions :
Differentiate y=sinx :
Differentiate y=cos x :
Differentiate y=tan x :
Please complete your worksheet on Lesson 1, and proceed to lesson 2.
Differentiate y=sinx :
Differentiate y=cos x :
Differentiate y=tan x :
Please complete your worksheet on Lesson 1, and proceed to lesson 2.
Wednesday, February 1, 2012
A.Maths Chapter 17: Differentiation of Trigo Functions.
In this chapter we will learn to derive the formulas for differentiating trigonometric functions.
Proceed through the following lessons.
Pre Lesson : Application of Differentiation in Real Life Application.
http://coolmathwithkhan.blogspot.com/2012/02/pre-lesson-real-life-application-of.html
Lesson 1 : Differentiation of Basic Trigonometric Functions :
http://coolmathwithkhan.blogspot.com/2012/02/derivation-of-formulas-for.html
Lesson 2: Differentiation of trigonometric functions of powers n :
http://coolmathwithkhan.blogspot.com/2012/02/lesson-2-differentiation-of-further.html
Lesson 3: Differentiation of trigonometric functions of function (ax+b) :
http://coolmathwithkhan.blogspot.com/2012/02/lesson-3-differentiation-of.html
Lesson 4: Examples on Differentiating Trigonometric Functions and Equations:
http://coolmathwithkhan.blogspot.com/2012/02/lesson-4-examples-on-differentiating.html
Lesson 5: Practice on DI worksheet.
Saturday, January 21, 2012
Lesson (1.3) : Comparison of mean and standard deviation of two sets of data
Here we will learn to compare two sets of data and find intrepretations and make conclusions from its mean and standard deviation.
We begin by finding about the meaning of the word consistency and its relationship to standard deviation by comparing data from 2 bowlers from these videos below :
So from this videos we learn that although two data can have the same mean or average , they can have different standard deviation.
A smaller standard deviation means that it is more consistent to the average.
A larger standard deviation means it is less consistent to the average.
Read the example 6 page 16 , by clicking on the image below :


In your E.Maths Book 1, please complete
Exercise 1.3: Qn 1, 3, 7 and 8
Revision Exercise 1 : Qn 1-4 and Qn 8.
Please hand in on Wednesday 25th January.
Friday, January 20, 2012
Lesson (1.2) Part B: Formula
In this lesson we will learn how to calculate standard deviation of grouped data using the following formula :

Example of finding standard deviation from grouped data with discrete x :

Now we shall learn how to find Standard deviation from classified grouped data :
We can use the same formula or another alternative formula given by :

You can see how this formula is applied in the following video :
Lesson (1.2) Part A: Introduction to Grouped data.
First what is grouped data ?
Grouped Data is when Raw Data has been classified into a frequency table.
Example of Raw Data converted into frequency table :
Example of grouped data :

There is also another kind of frequency table called Grouped Class Interval Data :
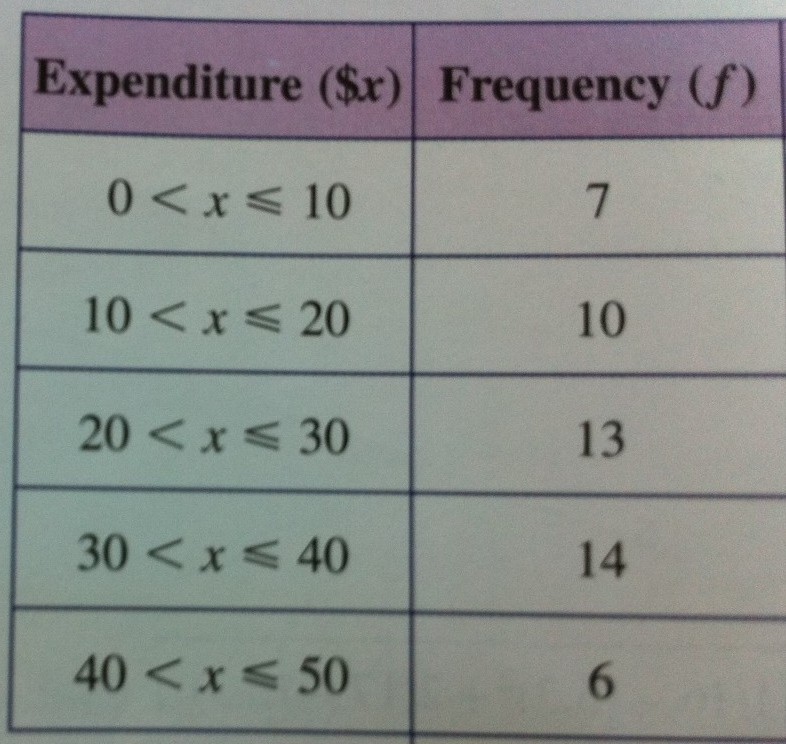
We need to learn how to find mean, mode and median of grouped data before we learn how to find Standard Deviation of grouped data.
He is how we calculate mean, mode and median of grouped data :
To learn how to find Standard Deviation of grouped data, we shall learn from Part(B) in the next lesson.


(1.1) Part A : Definition of Standard Deviation.
Standard Deviation:
The Standard Deviation is a measure of how spread out numbers are.
Deviation just means how far from the normal.
Its symbol is σ (the greek letter sigma)
What does it mean? :
It shows how much variation or "dispersion" exists from the average (mean, or expected value).
A low standard deviation indicates that the data points tend to be very close to the mean, whereas high standard deviation indicates that the data points are spread out over a large range of values.
Graphical illustration :
 You can see from the illustration above that although all 3 graphs have the same mean or same average which is mean = 0 ,
the standard deviations are different.
The blue graph is less "spread out" while the red graph is the most "spread out".
We can say that the Blue graph has the lowest standard deviation while the Red Graph has the highest standard deviation.
Practical Application examples :
The practical value of understanding the standard deviation of a set of values is in appreciating how much variation there is from the "average" (mean).
Climate:
As a simple example, consider the average daily maximum temperatures for two cities, one inland and one on the coast. It is helpful to understand that the range of daily maximum temperatures for cities near the coast is smaller than for cities inland. Thus, while these two cities may each have the same average maximum temperature, the standard deviation of the daily maximum temperature for the coastal city will be less than that of the inland city as, on any particular day, the actual maximum temperature is more likely to be farther from the average maximum temperature for the inland city than for the coastal one.
Sports:
Another way of seeing it is to consider sports teams. In any set of categories, there will be teams that rate highly at some things and poorly at others.
Chances are, the teams that lead in the standings will not show such disparity but will perform well in most categories.
The lower the standard deviation of their ratings in each category, the more balanced and consistent they will tend to be.
Teams with a higher standard deviation, however, will be more unpredictable.
For example, a team that is consistently bad in most categories will have a low standard deviation.
A team that is consistently good in most categories will also have a low standard deviation. However, a team with a high standard deviation might be the type of team that scores a lot (strong offense) but also concedes a lot (weak defense), or, vice versa, that might have a poor offense but compensates by being difficult to score on.
Trying to predict which teams, on any given day, will win, may include looking at the standard deviations of the various team "stats" ratings, in which anomalies can match strengths vs. weaknesses to attempt to understand what factors may prevail as stronger indicators of eventual scoring outcomes.
In racing, a driver is timed on successive laps.
A driver with a low standard deviation of lap times is more consistent than a driver with a higher standard deviation.
This information can be used to help understand where opportunities might be found to reduce lap times.
Chapter 1 : Standard Deviation.
The Chapter on Standard Deviation has 3 lessons.
Lesson 1.1: Standard Deviation for ungrouped data.
A.Definition
http://coolmathwithkhan.blogspot.com/2012/01/11-part-definition-of-standard.html
B.Formula
http://coolmathwithkhan.blogspot.com/2012/01/11-part-b-formula.html
Lesson 1.2: Standard deviation for grouped data.
A.Definition
http://coolmathwithkhan.blogspot.com/2012/01/lesson-12-part-introduction-to-grouped.html
B.Formula
http://coolmathwithkhan.blogspot.com/2012/01/lesson-12-part-b-formula.html
C.Using a calculator to calculate Mean and Standard Deviation.
http://coolmathwithkhan.blogspot.com/2012/01/12-calculating-mean-and-standard.html
Lesson 1.3: Comparison of two data sets for Mean and Standard Deviation.
http://coolmathwithkhan.blogspot.com/2012/01/lesson-13-comparison-of-mean-and.html
End of Chapter 1.
(1.2) Part C : Calculating Mean and Standard Deviation using Calculator.
For this section, we will learn how to calculate the mean and standard deviation using the calculator.
Get your calculators ready:
For Sharp Model calculators follow the instructions on the image below on page 11 of your textbook:

Alternatively you can watch the videos below and follow the instructions,
For Casio Calculators watch this video :
For Sharp Calculators watch this video:
Now let's try an example of finding standard deviation of (Unclassified) grouped data from this video :
Now for an example on classified grouped data :
In your E.Maths Exercise Book 1 , please do the following questions from Ex 1.2 using only your calculator:
Qn 4, 5, 6 and 7 as shown in the images below :


Prepare to hand in your E.Maths Book 1 on Wednesday !!
Oh by the way watch this for fun... Cool !!!
Subscribe to:
Comments (Atom)